
Two years into the COVID-19 pandemic, conditions in the U.S. have shown marked signs of improvement. While the Omicron wave brought a massive spike in cases, case counts have declined rapidly since peaking in mid-January, and the latest variant saw milder effects. In light of these shifts, more states and localities have moved to relax their remaining public health restrictions, and the CDC recently announced updated guidance that relaxed recommendations on the use of masks.
The emergence of vaccines to protect against COVID-19 in late 2020 helped lay the groundwork for what some are now calling the virus’s endemic stage. An accelerated process of developing, testing, manufacturing, and distributing vaccines has allowed more than 250 million Americans to receive at least one dose since vaccines first became available. With greater protection, COVID’s risk to much of the population has been significantly reduced. For example, during the recent Omicron wave, vaccinated individuals showed far lower rates of hospitalization and death than their unvaccinated counterparts.
Data indicates that the U.S. may now be reaching a limit on its vaccinated population. The first COVID-19 vaccine doses in the U.S. were administered in December 2020. As vaccine manufacturers ramped up production and more populations became eligible to receive the vaccine in the first few months of 2021, the number of people who had received at least one dose grew quickly, peaking at more than 2.5 million first doses administered per day in early April.
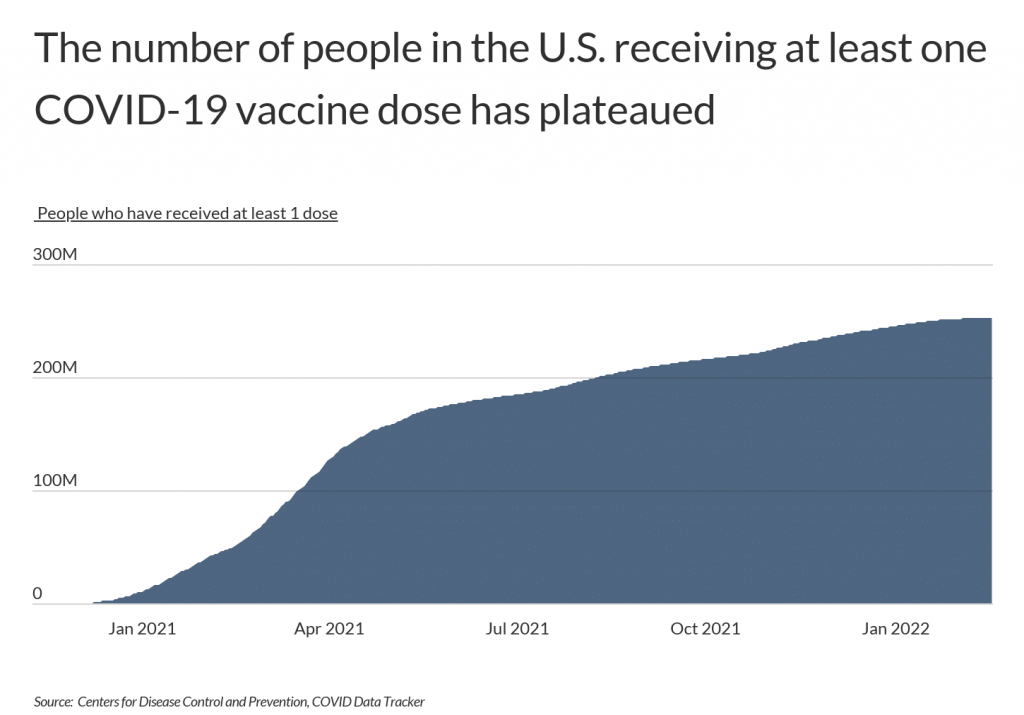
But shortly after all adults became eligible to receive a vaccine in April 2021, the daily number of first doses reported began to slow. While the cumulative number of vaccine recipients continued to grow for the remainder of 2021 and into 2022, the number has plateaued in recent weeks. This suggests that most of those who remain unvaccinated at this point are likely to stay that way.
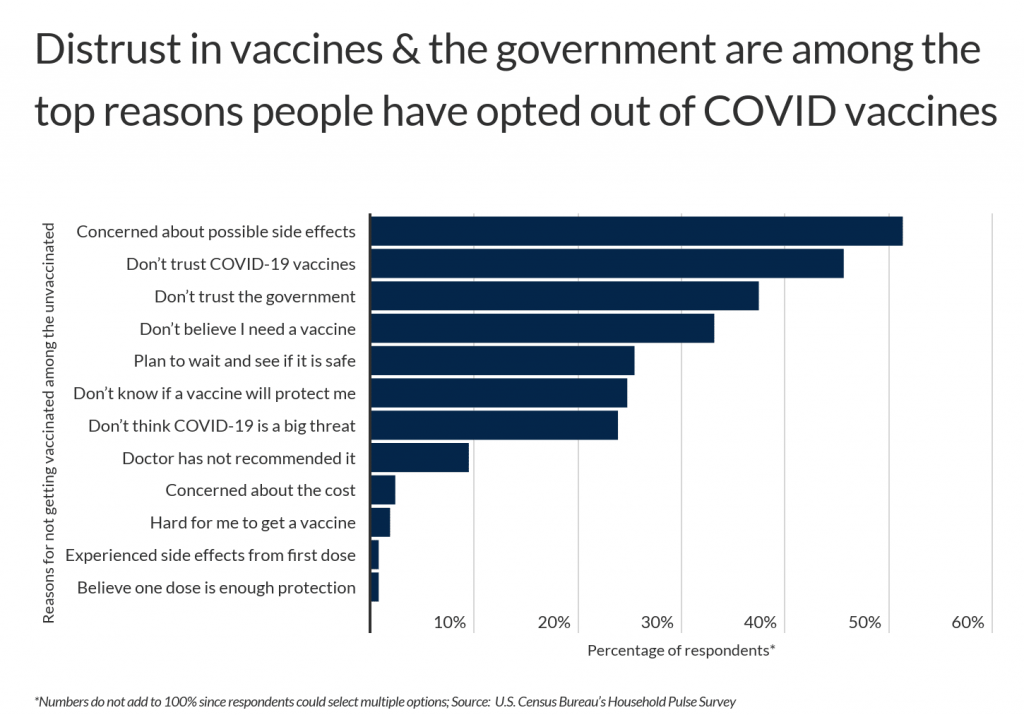
Public health leaders have made efforts to overcome skepticism and resistance to COVID-19 vaccines, but around one-quarter of the total U.S. population still have not received a dose of the vaccine. A large share of hesitation comes from concerns about the vaccine itself: according to survey data from the U.S. Census Bureau, 51.3% of those who are unvaccinated named concern about possible side effects as a reason, and 45.6% said they don’t trust COVID-19 vaccines.
TRENDING
The main goal of a website builder is to simplify and streamline the web design process. Users choose from existing templates or themes and then use the design interface to customize their website to their needs. These are the best free website builders we can find.
But the choice of whether to get vaccinated has undeniably taken on political character as well. In the same survey data, 37.4% of unvaccinated individuals named not trusting the government as one of the reasons why. Given the government’s key role in supporting the development and distribution of the vaccines, this group will remain difficult to persuade.
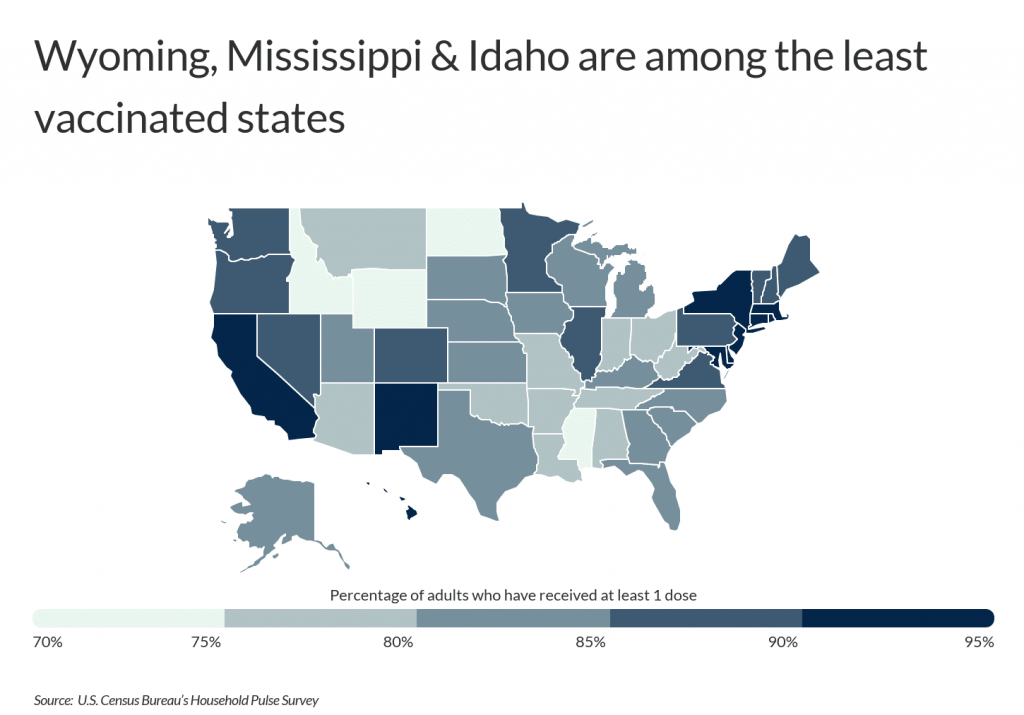
Political attitudes provide some explanation for which states have a lower share of residents who have received a vaccine. States in the West and Northeast, which tend to be more politically liberal, have the highest percentage of adults who have received at least one dose, led by Hawaii at 95.1%. Many of the states with lower percentages of vaccinated individuals are more conservative states in the South and Mountain West, including Wyoming (68.7%), Mississippi (69.9%), and Idaho (72.5%).
The survey data provides more evidence for this relationship. States like Alabama and Montana have both high levels of distrust in government and high percentages of unvaccinated individuals. However, distrust in government among the unvaccinated does not perfectly map onto state vaccination rates. Even some states where high numbers of people have been vaccinated, including Oregon, Colorado, and Delaware, have large shares of unvaccinated individuals who cite not trusting the government as a reason not to receive a dose.
The data used in this analysis is from the U.S. Census Bureau’s Household Pulse Survey, collected in the first week of February 2022. To determine the states whose residents don’t trust the government, researchers at ChamberOfCommerce.org calculated the share of unvaccinated adults who cited distrust in the government as one of the reasons for not receiving or planning to receive a COVID-19 vaccine. In the event of a tie, the state with the higher share of unvaccinated adults who report that they will likely not get vaccinated was ranked higher.
Here are the states whose unvaccinated residents do not trust the government.
States Whose Residents Don’t Trust the Government
15. Georgia
- Share of unvaccinated adults who cited distrust in govt.: 39.1%
- Share of unvaccinated adults who likely won’t get vaccinated: 69.9%
- Share of adults who are unvaccinated: 17.3%
- Total unvaccinated adults who cited distrust in govt.: 493,454
- Total unvaccinated adults who likely won’t get vaccinated: 962,148
- Total adults who are unvaccinated: 1,376,568
DID YOU KNOW?
In addition to being able to upload and save a single resume for multiple applications, job search engines provide access to thousands of job listings in a matter of seconds. Check out the best job search engines of 2022.
14. Tennessee
- Share of unvaccinated adults who cited distrust in govt.: 39.9%
- Share of unvaccinated adults who likely won’t get vaccinated: 73.1%
- Share of adults who are unvaccinated: 21.2%
- Total unvaccinated adults who cited distrust in govt.: 424,499
- Total unvaccinated adults who likely won’t get vaccinated: 813,476
- Total adults who are unvaccinated: 1,112,777
13. North Carolina
- Share of unvaccinated adults who cited distrust in govt.: 40.4%
- Share of unvaccinated adults who likely won’t get vaccinated: 67.3%
- Share of adults who are unvaccinated: 15.9%
- Total unvaccinated adults who cited distrust in govt.: 505,114
- Total unvaccinated adults who likely won’t get vaccinated: 858,913
- Total adults who are unvaccinated: 1,277,151
12. Wyoming
- Share of unvaccinated adults who cited distrust in govt.: 40.5%
- Share of unvaccinated adults who likely won’t get vaccinated: 78.9%
- Share of adults who are unvaccinated: 31.3%
- Total unvaccinated adults who cited distrust in govt.: 53,646
- Total unvaccinated adults who likely won’t get vaccinated: 107,306
- Total adults who are unvaccinated: 136,038
11. Indiana
- Share of unvaccinated adults who cited distrust in govt.: 40.9%
- Share of unvaccinated adults who likely won’t get vaccinated: 74.7%
- Share of adults who are unvaccinated: 21.3%
- Total unvaccinated adults who cited distrust in govt.: 417,793
- Total unvaccinated adults who likely won’t get vaccinated: 796,426
- Total adults who are unvaccinated: 1,066,495
10. Utah
- Share of unvaccinated adults who cited distrust in govt.: 41.3%
- Share of unvaccinated adults who likely won’t get vaccinated: 84.1%
- Share of adults who are unvaccinated: 16.2%
- Total unvaccinated adults who cited distrust in govt.: 151,739
- Total unvaccinated adults who likely won’t get vaccinated: 314,383
- Total adults who are unvaccinated: 373,794
9. Iowa
- Share of unvaccinated adults who cited distrust in govt.: 41.6%
- Share of unvaccinated adults who likely won’t get vaccinated: 74.2%
- Share of adults who are unvaccinated: 18.2%
- Total unvaccinated adults who cited distrust in govt.: 174,974
- Total unvaccinated adults who likely won’t get vaccinated: 313,090
- Total adults who are unvaccinated: 421,691
8. Colorado
- Share of unvaccinated adults who cited distrust in govt.: 41.7%
- Share of unvaccinated adults who likely won’t get vaccinated: 80.8%
- Share of adults who are unvaccinated: 11.3%
- Total unvaccinated adults who cited distrust in govt.: 196,091
- Total unvaccinated adults who likely won’t get vaccinated: 410,331
- Total adults who are unvaccinated: 507,523
7. Minnesota
- Share of unvaccinated adults who cited distrust in govt.: 42.4%
- Share of unvaccinated adults who likely won’t get vaccinated: 81.6%
- Share of adults who are unvaccinated: 12.3%
- Total unvaccinated adults who cited distrust in govt.: 211,575
- Total unvaccinated adults who likely won’t get vaccinated: 421,376
- Total adults who are unvaccinated: 516,695
6. Delaware
- Share of unvaccinated adults who cited distrust in govt.: 42.9%
- Share of unvaccinated adults who likely won’t get vaccinated: 65.9%
- Share of adults who are unvaccinated: 7.9%
- Total unvaccinated adults who cited distrust in govt.: 26,073
- Total unvaccinated adults who likely won’t get vaccinated: 39,685
- Total adults who are unvaccinated: 60,204
5. Oregon
- Share of unvaccinated adults who cited distrust in govt.: 43.1%
- Share of unvaccinated adults who likely won’t get vaccinated: 74.7%
- Share of adults who are unvaccinated: 11.9%
- Total unvaccinated adults who cited distrust in govt.: 158,219
- Total unvaccinated adults who likely won’t get vaccinated: 293,415
- Total adults who are unvaccinated: 392,913
TRENDING
There’s always an opportunity—and need—to improve your position in the stock market. A stockbroker can help, but you should be aware of what to look for. Here are some tips as well as a list of the best online stockbrokers in 2022.
4. Maine
- Share of unvaccinated adults who cited distrust in govt.: 43.3%
- Share of unvaccinated adults who likely won’t get vaccinated: 70.8%
- Share of adults who are unvaccinated: 12.5%
- Total unvaccinated adults who cited distrust in govt.: 54,389
- Total unvaccinated adults who likely won’t get vaccinated: 94,821
- Total adults who are unvaccinated: 134,008
3. Kentucky
- Share of unvaccinated adults who cited distrust in govt.: 44.2%
- Share of unvaccinated adults who likely won’t get vaccinated: 77.8%
- Share of adults who are unvaccinated: 17.9%
- Total unvaccinated adults who cited distrust in govt.: 253,489
- Total unvaccinated adults who likely won’t get vaccinated: 462,058
- Total adults who are unvaccinated: 593,736
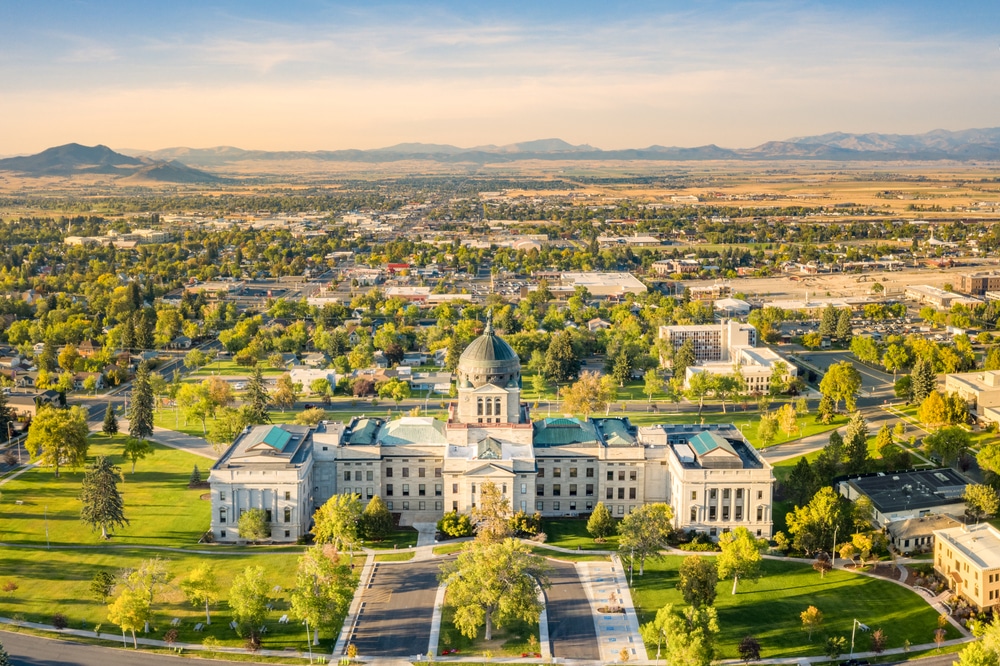
2. Montana
- Share of unvaccinated adults who cited distrust in govt.: 51.6%
- Share of unvaccinated adults who likely won’t get vaccinated: 85.6%
- Share of adults who are unvaccinated: 21.7%
- Total unvaccinated adults who cited distrust in govt.: 88,743
- Total unvaccinated adults who likely won’t get vaccinated: 153,472
- Total adults who are unvaccinated: 179,274
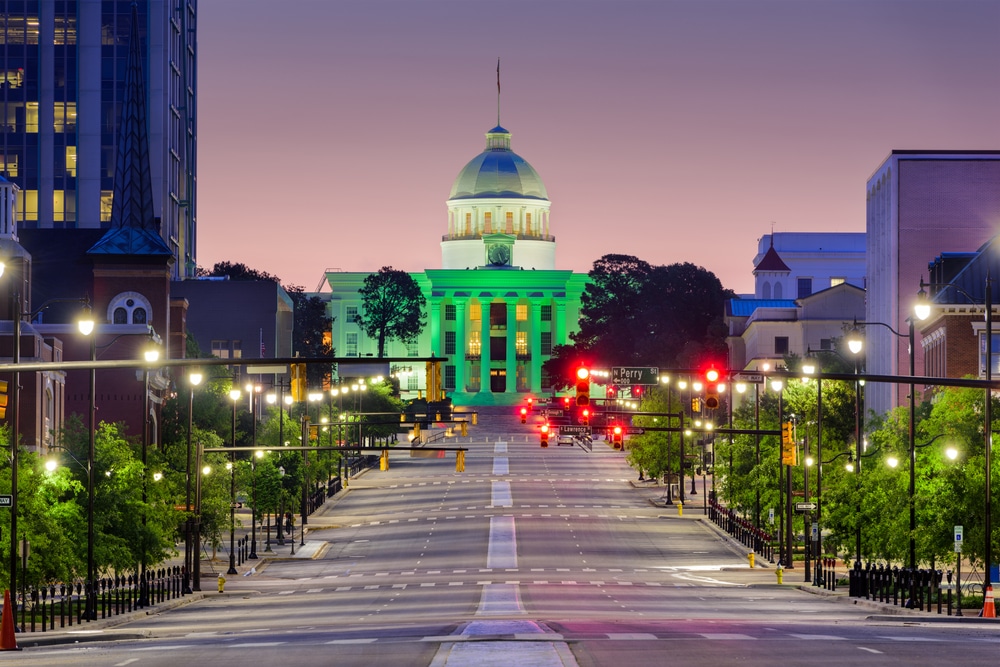
1. Alabama
- Share of unvaccinated adults who cited distrust in govt.: 51.7%
- Share of unvaccinated adults who likely won’t get vaccinated: 75.3%
- Share of adults who are unvaccinated: 22.8%
- Total unvaccinated adults who cited distrust in govt.: 418,404
- Total unvaccinated adults who likely won’t get vaccinated: 635,795
- Total adults who are unvaccinated: 844,199
Detailed Findings & Methodology
The data used in this analysis is from the U.S. Census Bureau’s Household Pulse Survey, collected in the first week of February 2022. To determine the states whose residents don’t trust the government, researchers calculated the share of unvaccinated adults who cited distrust in the government as one of the reasons for not receiving or planning to receive a COVID-19 vaccine. In the event of a tie, the state with the higher share of unvaccinated adults who likely won’t get vaccinated was ranked higher. Adults deemed as those who likely won’t get vaccinated were a combination of respondents who answered either “will probably not get a vaccine” or “will definitely not get a vaccine.”